One of the characteristics of any given frequency distribution is central tendency. The characteristic by virtue of which the values of a variable tend to cluster around at the central part of the frequency distribution is called central tendency. A measure of central tendency is called an average.
An average which is used to represent the whole series should neither have the lowest value nor the highest value in the group, but a value somewhere between two limits, possibly in the centre, where most of the items of the group cluster. In other words an average is a represented value of the whole set of observations, e.g., when we say “Germans are taller than Indians” we mean the average height of Germans is more than the average height of Indians. Sometimes a measure of central tendency is called a measure of location because it locates the position of the frequency distribution on the axis of the variable.
An ideal measure of central tendency should have the following characteristics:
- It should be rigidly defined so as to avoid different people choosing different values for the same measure of central tendency.
- It should be easily comprehensible and easy to calculate.
- It should be based upon all observations.
- It should be amenable for further mathematical treatment.
- It should be affected as little as possible by the presence of extreme values.
- It should be least affected by sampling fluctuation, i.e., an ideal measure of central tendency should not vary in its value too much from one sample to another when all the samples are taken from the same set of observations.
Some common measures of central tendency are as follows:
- Arithmetic Mean
- Geometric Mean
- Harmonic Mean
- Median
- Mode
Arithmetic mean:
The arithmetic mean of a data set is defined to be the sum of all the observations of the data set divided by the total number of observations in the data set.
If


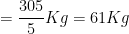
Example: The weights (in Kilogram) of 5 persons are 67, 65, 71, 57 and 45. Find the arithmetic mean of their weights.
Solution:
According to the definition of A.M.:
Arithmetic Mean


For frequency type data (discrete or continuous), if If


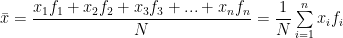
This may be looked upon as the weighted A.M. of
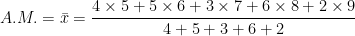
Example: Find the mean:
| x | 5 | 6 | 7 | 8 | 9 |
| f | 4 | 5 | 3 | 6 | 2 |
Solution:
 |
 |
 |
| 5 | 4 | 20 |
| 6 | 5 | 30 |
| 7 | 3 | 21 |
| 8 | 6 | 48 |
| 9 | 2 | 18 |
| Total | 20 | 137 |


Arithmetic Mean


Hence we have,


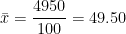
If there are class intervals then we find out the class mark or mid-value of each class interval and treat it as the representative value of that particular class, i.e., we multiply the class mark of each class with the frequency of that class and add these values. In a sense, we are ignoring the class intervals by replacing them by their respective class marks and in doing so we are converting the grouped frequency distribution with class intervals into a simple frequency distribution with individual values and corresponding frequencies instead of class intervals.
Example: Find the mean of the following frequency distributuion
| Class Intervals | Frequencies |
| 20-30 | 13 |
| 30-40 | 18 |
| 40-50 | 26 |
| 50-60 | 13 |
| 60-70 | 18 |
| 70-80 | 12 |
| Total | 100 |
Solution:
| Class Intervals | Frequencies ( |
Class Marks ( |
|
| 20-30 | 10 | 25 | 250 |
| 30-40 | 20 | 35 | 700 |
| 40-50 | 25 | 45 | 1125 |
| 50-60 | 15 | 55 | 825 |
| 60-70 | 20 | 65 | 1300 |
| 70-80 | 10 | 75 | 750 |
| Total | 100 | – | 4950 |

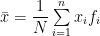
Now here,

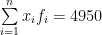
and,


Properties of Arithmetic Mean (A.M.):
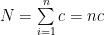
If all the values of the variable are equal, then A.M. is the common value.
Proof:
Suppose


If each of the values of a variable occurs equal number of times, then simple A.M. and weighted A.M. are same.
Proof:
Suppose


A.M. depends upon the change of origin and scale both.
Proof:
If


Then


Corollaries:
- If each observation under consideration is increased by a quantity
- If each observation under consideration is decreased by a quantity
- If each observation under consideration is multiplied by a quantity
- If each observation under consideration is divided by a quantity
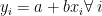
If


Proof:
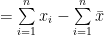


Sum of the square of the deviations of the observations from their A.M. is least.
Proof:
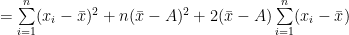
Sum of the square of the deviations of the observations from their A.M.


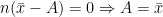
Now, for any arbitrary A,


![=\sum\limits_{i=1}^{n}[(x_{i}-\bar{x})+(\bar{x}-A)]^2](https://s0.wp.com/latex.php?latex=%3D%5Csum%5Climits_%7Bi%3D1%7D%5E%7Bn%7D%5B%28x_%7Bi%7D-%5Cbar%7Bx%7D%29%2B%28%5Cbar%7Bx%7D-A%29%5D%5E2+&bg=ffffff&fg=000&s=0&c=20201002)


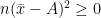
‘


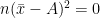
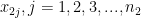
i.e., when


If we have two sets of values, the first set having


Proof:
Suppose the observations of the first set be


and those of the second set be


And


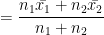
In general, for


Merits and Demerits of Arithmetic Mean (A.M.):
Merits:
- It is rigidly defined.
- It is easily comprehensible and easy to calculate.
- A.M. is based upon all observations in the data set.
- A.M. is amenable to further mathematical treatment.
- A.M. is least affected by sampling fluctuation.
Demerits:
- A.M. is highly affected by the presence of extreme values.
- If a frequency distribution has open-end classes, A.M. cannot be determined.
Exercise:
1. The average marks obtained by a class of 70 students was found to be 65. Later on it was detected that the marks of one student was wrongly recorded as 85 instead of 58. Find the correct mean.
2. The frequency distribution of monthly income (in Rs.) of 200 families in a community is as under where frequencies of two classes are missing:
| Income (Rs. ‘000) | 3-5 | 5-7 | 7-9 | 11-13 | Total |
| Number of families | 32 | ? | 57 | ? | 200 |
The average monthly income of these 200 families is known to be Rs. 7740. Find the missing frequencies.
3. A professor teaches two sections of a Statistics Class. Section 1 has 25 students and their average on a test was 82. Section 2 has 15 students and their average on the same test was 74. What is the average on this test if the professor combines the scores for both the classes?